A decision tree is a machine learning algorithm that takes the form of an algorithmic flowchart. Usable for both classification and regression, decision trees are also easy to interpret and implement. This makes them a near-perfect choice for anyone who’s relatively new to or unfamiliar with machine learning.
Decision trees are frequently used for predictive modeling in data mining, machine learning, and statistics. They’re also frequently used in ensemble learning.
Components of a Decision Tree
Before we talk much more about decision trees, we should quickly go over their components – and also touch on some terminology associated with them.
- The root node sits at the top of a decision tree, classifying data samples based on specified conditions or features.
- Decision nodes serve the same purpose as the root node, classifying the data samples they receive based on predefined rules.
- Leaf nodes, also known as terminal nodes, sit at the very bottom of the decision tree, where they represent the model’s final output. Further classification or splitting is not possible at this stage.
- Branches connect the root node, decision nodes, and leaf nodes to one another. Each branch represents the application of a label to a data sample.
- A sub-tree is simply fancy terminology that refers to a section of the decision tree.
- When a node is divided into multiple sub-nodes, those subnodes are known as parent and child nodes.
How Does A Decision Tree Algorithm Work?
Although a decision tree may at first look highly complex, the reality is that they’re really just a series of nested else/if statements. The best way to demonstrate this is likely through an example. Let’s say you want to code a simple classification algorithm that determines whether or not you want to go outside based on the weather.
It might look a little something like this:
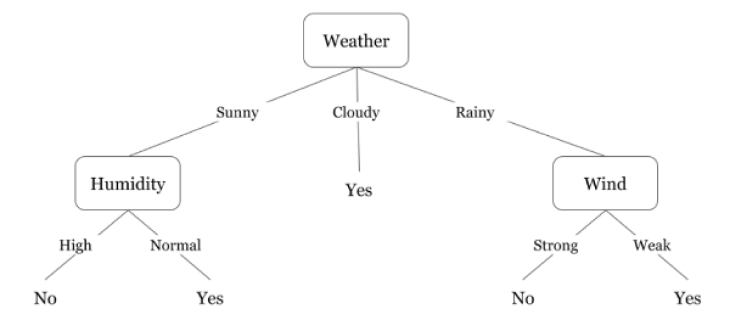
Let’s trace our way from root to leaf in this tree.
- The weather is sunny, so we apply that label and then move down to the first decision node, humidity.
- The humidity is normal, so we apply that label and move down to the leaf node.
- The leaf node indicates that the weather is fine, and you can go outside at your leisure.
There are four main types of decision trees, categorized based on their primary use case.
- Classification
- Regression
- Cost-complexity pruning
- Reduced error pruning
There are also many different decision tree algorithms you might potentially use, each with its own strengths and weaknesses:
- ID3
- C4.5
- Random Forest
- Cart
That said, Random Forest is generally considered the best, combining decision trees with ensemble learning to reduce overfitting and increase accuracy.
What to Consider When Creating a Decision Tree
Whether you use a decision tree for analysis, classification, or regression, there are a few things you’ll want to bear in mind if you decide to create one. First and foremost, a decision tree works best when each “decision” in a data set can be represented as a binary choice. For classification problems where data cannot be easily divided into subsets based on individual features or conditions, a decision tree may be a poor option.
Decision trees also use something known as recursive partitioning. Each node is subdivided into two or more child nodes until the tree reaches a stopping point. This means that in the case of larger and more complex data sets, a decision tree can quickly spiral out of control in terms of size.
Next, although decision trees can handle both numerical and categorical features, they require a different approach to splitting for each. In addition, they make several assumptions about the data set they are meant to classify:
- There are no outliers in the data.
- There are no missing values in the data.
- Every feature has equal importance.
- The features used for splitting nodes are independent from one another.
Most of these assumptions can be managed through techniques such as scaling, weighting, and data augmentation. At a certain point, however, considering a different classification model may be worthwhile, particularly if your data set contains considerable noise.
Decision trees are also highly sensitive to sample size. With smaller samples, they’re prone to overfitting, and with larger samples, they’re prone to encountering issues with complexity. Unfortunately, there’s only so much you can do in either of these scenarios.
Depending on the nature of your data set, you’re also going to want to think about when to stop splitting your tree. The best way to answer this question is through a method known as hyperparameter tuning. This allows you to either set a maximum depth, a minimum number of splits, a minimum number of samples per leaf, or a maximum number of features.
Finally, you may also want to familiarize yourself with pruning. This method assists in improving a decision tree’s performance by cutting out insignificant nodes and subnodes. This can either be done when still building the tree or after the tree has already reached maximum depth.
Assessing the Quality of a Decision Tree
Decision trees are typically constructed and evaluated through a metric known as Gini Impurity, which also plays a crucial role in their construction. This metric allows a data scientist to quantitatively evaluate the effectiveness of a split by predicting the likelihood that a decision tree will incorrectly label a randomly selected data sample. It’s expressed as a number from 0-1.
In this context, 0 means the data sample is completely pure – all the data it contains belongs to the same class. A 1, on the other hand, indicates that only a single class exists. Finally, a 0.5 indicates uniform distribution.
Entropy is another important concept where decision trees are concerned. In layman’s terms, entropy measures the randomness or uncertainty present in individual decision tree nodes. A low entropy means high purity, and a high entropy means low purity.
Finally, information gain is basically a data set-wide measure of entropy. It measures the entropy of your data against a specific feature.