
Data cleaning is a vital process in data science that involves identifying and correcting errors or inconsistencies in acquired data. It is a fundamental step in data analysis, but the process is often not always straightforward, as data can come in various formats and quality levels. Therefore, data scientists have developed various techniques to clean data, which we will explore in this blog.
In this article, we’ll cover the following:
- Why is data cleaning so important?
- Characteristics of quality data
- 5 main data cleaning techniques
- Best practices for data cleaning
Why is data cleaning so important?
Firstly, inaccurate data can lead to incorrect conclusions and poor decision-making. For example, if a company analyzes sales data that contains duplicate entries or incorrect values using a machine learning model, it may make the wrong decisions regarding inventory, pricing, or marketing strategies, leading to lost sales and revenue.
Data analysts spend a significant amount of time identifying and correcting errors manually, which can be time-consuming and error-prone. Automating that process reduces time spent dealing with unclean data and leads to faster conclusions.
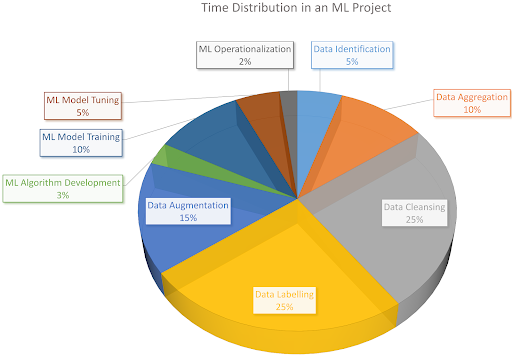
Time spent in an average ML project. The majority of the time goes into data preprocessing.
Data cleaning also improves the quality of data used in machine learning and predictive analytics models. Most machine learning models are very sensitive to the training data and ensuring that it is accurate and consistent is crucial to obtain accurate predictions.
Finally, data cleaning helps to ensure compliance with data privacy and security regulations. Many regulations, such as the General Data Protection Regulation (GDPR) in the European Union, require organizations to ensure that personal data is accurate and up-to-date. By cleaning data regularly, organizations can ensure compliance with these regulations and avoid potential legal and financial penalties.
Characteristics of Quality Data
Quality data is a crucial factor in Machine Learning projects to make informed decisions and gain valuable insights. Here are five characteristics of quality data:
- Accuracy: Quality data must be accurate and feasible, meaning it should be free of errors, although 100% accurate data is utopian. The data must reflect the reality of the situation, and any inaccuracies could lead to incorrect conclusions and poor decision-making. Models can be trained to be robust to noise in the training data, but the test data should be reliable since that is what a model is evaluated on, which can only be achieved if the data is cleaned beforehand.
- Completeness: Completeness means that all necessary data points are present. Missing or incomplete data can sometimes be impossible to amend, resulting in the entire data row being dropped, leading to the loss of several data points. But this can be fixed by using appropriate constraints instead of removing data samples completely.
- Consistency: Consistency means that data must be standardized and follow a uniform format. Inconsistent data can make it difficult to compare and analyze data across different sources.
- Relevance: Quality data must be relevant, meaning that it is directly related to the problem being addressed. Irrelevant data can lead to wasted time and resources and may not provide valuable insights.
- Validity: Data should be up-to-date and relevant to the current business context. Outdated data can lead to poor decision-making and lost opportunities to capitalize on current trends and patterns.
5 main data cleaning techniques
Data cleaning is a critical step in the data preprocessing pipeline. It involves identifying and correcting errors and inconsistencies to ensure that the data used for analysis is accurate, reliable, and consistent. Let us dive into the five main data-cleaning techniques along with Python code implementations.
1. Handling Missing Values
Missing values are a common problem in datasets and can occur for various reasons, such as data entry errors, equipment malfunctions, or incomplete surveys. It is crucial to handle missing values appropriately, as they can lead to biased analysis and inaccurate results. There are several techniques for handling missing values, two of which we will discuss next.
Removing missing values
In some cases, removing observations that contain missing values may be appropriate. This technique is called complete case analysis and involves removing any observation that contains one or more missing values.
import pandas as pd

# Load data
df = pd.read_csv('data.csv')

# Drop rows with missing values
df_clean = df.dropna()
Imputing missing values
Simply dropping values might lead to several data points being missing in the dataset. Instead, it may be appropriate to impute missing values, which involves replacing missing values with estimates based on the available data. There are several techniques for imputing missing values, including mean imputation, median imputation, and regression imputation.
import pandas as pd
from sklearn.impute import SimpleImputer

# Load data
df = pd.read_csv('data.csv')

# Impute missing values using mean imputation
imputer = SimpleImputer(strategy='mean')
df_clean = pd.DataFrame(imputer.fit_transform(df), columns=df.columns)
In this code snippet, we imputed missing values using mean imputation with the SimpleImputer() method from scikit-learn.
2. Removing Duplicates
Duplicate observations can lead to biased analysis and inaccurate results. Identifying and removing duplicates is crucial to ensure the data used for analysis is accurate and reliable.
Dropping exact duplicates
This technique involves removing observations that are identical across all variables. Duplicate records can skew the results of data analysis. When there are exact duplicates in the dataset, it can lead to inflated counts or misleading statistics, which can impact the accuracy of the analysis. Additionally, duplicates can cause memory issues and slow the analysis process, especially when working with large datasets.
import pandas as pd

# Load data
df = pd.read_csv('data.csv')

# Drop exact duplicates
df_clean = df.drop_duplicates()
Fuzzy matching
Sometimes, duplicates in a dataset may not be exact matches due to variations in data entry or formatting inconsistencies. These variations can include spelling errors, abbreviations, and different representations of the same data. Fuzzy matching techniques can be used to identify and remove these duplicates.
Fuzzy matching algorithms can help to identify and remove these duplicates by comparing the similarity of the data values rather than exact matches. By using fuzzy matching, analysts can identify duplicates that may have been missed by traditional exact matching techniques, leading to more accurate and complete data sets.
import pandas as pd
from fuzzywuzzy import fuzz

# Load data
df = pd.read_csv('data.csv')

# Identify fuzzy duplicates
duplicates = []
for i, row in df.iterrows():
    for j in range(i + 1, len(df)):
        if fuzz.ratio(row, df.iloc[j]) > 90:
            duplicates.append(j)

# Drop fuzzy duplicates
df_clean = df.drop(duplicates)
3. Handling Outliers
Outliers are extreme values that can have a significant impact on statistical analysis. Identifying and handling outliers appropriately is essential to avoid biased analysis and inaccurate results. Let us look at three techniques to handle outliers.
Trimming
Trimming is a method for handling outliers that involves removing extreme values from the dataset. However, this technique is useful when the outliers are few and significantly different from the rest of the data. Removing the outliers can reduce the impact of their extreme values, and the remaining data can be analyzed without interference.
import pandas as pd

# Load data
df = pd.read_csv('data.csv')

# Trimming
q1 = df[column].quantile(0.25)
q3 = df[column].quantile(0.75)
iqr = q3 - q1
df_clean = df[(df[column] > q1 - 1.5 * iqr) & (df[column] < q3 + 1.5 * iqr)]
Winsorizing
Winsorization is a technique for handling outliers that involves replacing extreme values with less extreme values. This technique reduces the impact of outliers on statistical analysis.
import pandas as pd
from scipy.stats.mstats import winsorize

# Load data
df = pd.read_csv('data.csv')

# Winsorize data
df_clean = pd.DataFrame(winsorize(df, limits=[0.05, 0.05]), columns=df.columns)
Coreset Evaluation
A Coreset is (usually) a small, weighted subset of the original input set of items, such that solving the problem on the Coreset will yield the same solution as solving the problem on the original big data (Fun fact: Using Coresets reduces your carbon footprint for the data cleaning pipeline. For other reasons to use Coresets, check out this video).
You can use the DataHeroes library to build a Coreset and then use a Coreset property called “Importance” to identify outliers in the dataset. For the Coreset computation, each data sample is given an “Importance” value based on how useful it is for the analysis (a visual example is shown below).
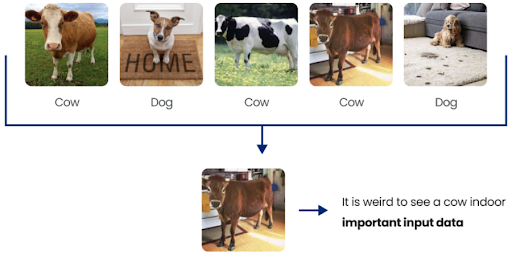
Reviewing the data samples which obtained a very high Importance value, can also help identify potential labeling errors because generally, situations that are out of the ordinary (like an indoor cow, which, in this case, is not an error) for a class in the dataset, will receive such high importance values.
from dataheroes import CoresetTreeServiceLG

# Build the coreset tree service object
self.coreset_service = CoresetTreeServiceLG(optimized_for='cleaning')
self.coreset_service.build(self.X, self.y)

# Get the top “num_images_to_view” most important samples
result = self.coreset_service.get_important_samples(
   class_size={self.predicted_classid: self.num_images_to_view}
)
important_sample_indices = result["idx"]
To learn more about how you can fix such incorrectly labeled data, check out this article.
4. Standardizing Data
Data standardization is a technique for transforming variables to have a common scale. When working with data from different sources or formats, there can be variations in how it is represented, such as differences in units of measurement, data formats, and data structures, making it difficult to compare variables or perform statistical analysis. Data standardization is a crucial step in such cases.
Min-max scaling
Min-max scaling involves rescaling the values of a variable to a range between 0 and 1. This is done by subtracting the minimum value of the variable from each value and dividing it by the variable’s range.
This technique is useful for normalizing data with different scales or units, making it easier to compare and analyze. Min-max scaling preserves the relative relationships between the values of the variable, but it can be sensitive to outliers and reduce the impact of extreme values.
import pandas as pd
from sklearn.preprocessing import MinMaxScaler

# Load data
df = pd.read_csv('data.csv')

# Min-max scale data
scaler = MinMaxScaler()
df_clean = pd.DataFrame(scaler.fit_transform(df), columns=df.columns)
Z-score normalization
This technique involves transforming the values of a variable to a standardized distribution with a mean of 0 and a standard deviation of 1. This is done by subtracting the variable’s mean from each value and dividing it by its standard deviation.
Z-score normalization also preserves the relative relationships between the values of the variable but is less sensitive to outliers than min-max scaling.
import pandas as pd
from sklearn.preprocessing import StandardScaler

# Load data
df = pd.read_csv('data.csv')

# Z-score normalize data
scaler = StandardScaler()
df_clean = pd.DataFrame(scaler.fit_transform(df), columns=df.columns)
5. Data Validation
Data validation is a process of checking and verifying that the data is accurate, complete, and consistent. Data validation techniques are used to identify and correct errors, inconsistencies, and outliers in the data that may affect the quality of the analysis.
Range Checks
Range checks are a data validation technique used to ensure that values fall within a specified range or domain. This technique is particularly useful for numerical data, where values outside a specified range may indicate errors or outliers.
def range_check(data, min_val, max_val):
    for value in data:
        if value < min_val or value > max_val:
            print("Value out of range:", value)
Logic Checks
Logic checks are a data validation technique used to ensure that the data conforms to a specified logical structure or relationship. This technique is particularly useful for checking the relationships between variables and can help identify errors in data entry or processing. For example, if a dataset contains variables representing a person’s height and weight, a logic check may be used to ensure that the Body Mass Index is calculated correctly.
def logic_check(data):
    for i in range(len(data)-1):
        if not is_valid(data[i], data[i+1]):
            print("Invalid values:", data[i], data[i+1])

def is_valid(value1, value2):
    # check if value1 and value2 conform to specified logical relationship
    return True or False
Using Coresets
As previously stated, the DataHeroes Coreset library, at its build phase, computes an “Importance” metric for each data sample which can help fix mislabeling errors, thus validating the dataset.
For example, let’s say we use the following code snippet to identify samples with very high “Importance” values, i.e., samples that are out of the ordinary for that class distribution.
from dataheroes import CoresetTreeServiceLG

# Build the coreset tree service object
self.coreset_service = CoresetTreeServiceLG(optimized_for='cleaning')
self.coreset_service.build(self.X, self.y)

# Get the top “num_images_to_view” most important samples
result = self.coreset_service.get_important_samples(
   class_size={self.predicted_classid: self.num_images_to_view}
)
important_sample_indices = result["idx"]
Now, one can either assign these samples to the true class, which is not always obvious to identify or feasible. So, in such cases, we may want to delete the samples to make the Coreset more accurate. To achieve this, we use the remove_samples function, as shown in the following code fragment.
# Removing the samples indices stored in `important_sample_indices` from the Coreset
self.coreset_service.remove_samples(self.deleted_idxes[self.iteration])
# Re-evaluate the AUROC score for the cleaned dataset
self.sample_weights[important_sample_indices] = 0
new_score = self.eval_lg_cv(sample_weights=new_weights)
To learn more about how to fix incorrectly labeled data (with working examples on the ImageNet dataset), check out this article.
Final Thoughts
Data cleaning is an essential step in the data preprocessing pipeline of machine learning projects. It involves identifying and correcting errors and removing inconsistencies to ensure that the data used for analysis is reliable. In this article, we discussed some of the best practices for data cleaning, including identifying and handling missing values, removing duplicates, handling outliers, and standardizing and validating the data. These techniques and tools can help ensure the data-cleaning process is efficient, effective, and consistent.
By cleaning data regularly, organizations can improve their decision-making, increase efficiency, improve the performance of predictive models, and ensure compliance with data privacy and security regulations.