
Anomalous data is a common issue that can occur in any data analysis process. Data anomalies refer to any unexpected or abnormal data points or patterns that differ from the typical behavior of the data. These anomalies can occur for various reasons, such as human error, instrument malfunction, or fraudulent activity. Anomalous data can significantly impact the accuracy and reliability of data analysis results, making it essential to detect and correct such anomalies. This article will discuss techniques for detecting and correcting anomalous data.
Types of Data Anomalies
Several types of data anomalies can occur in a dataset, such as:
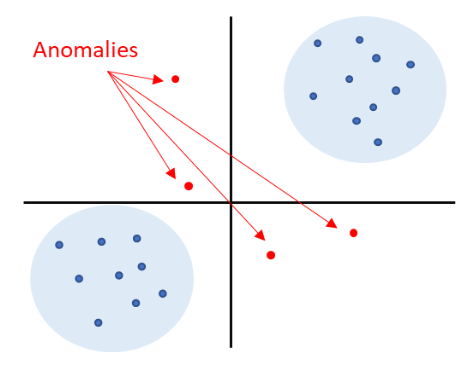
- Point Anomalies: A point anomaly (also called outlier) is a single data point that deviates significantly from the rest of the dataset. For example, in a dataset of students’ test scores, a score that is significantly higher or lower than the rest of the scores would be considered a point anomaly.
- Contextual Anomalies: A contextual anomaly occurs when a data point is considered anomalous only in a specific context. For example, a sudden increase in orders for umbrellas in a particular region may be a contextual anomaly if it occurs during a prolonged drought season.
- Collective Anomalies: A collective anomaly is a group of data points that deviate significantly from the rest of the dataset. For example, a sudden increase in the number of clicks on a website may be a collective anomaly if it is caused by a bot attack.
Detecting Data Anomalies
Detecting data anomalies involves identifying the abnormal data points or patterns that deviate significantly from the expected behavior of the dataset.
There are several techniques to detect that, including:
- Statistical Methods: Such as mean, median, standard deviation, and z-score, can be used to detect data anomalies. For example, if a data point’s z-score is greater than 3, it can be considered an anomalous data point. Another statistical method is using histograms, which can help identify outliers far away from the mean or median.
- Machine Learning: Machine learning algorithms, such as decision trees, k-means (when the number of clusters is known), or dbscan (when not known) clustering, and neural networks, can be used to detect data anomalies. These algorithms can identify anomalous data points based on their deviation from the expected behavior of the dataset. Machine learning algorithms can also identify complex patterns in the data that may not be detectable by statistical methods.
- Visualization Techniques: Visualization techniques, such as scatter plots, histograms, and box plots, can be used to detect data anomalies. These techniques can help identify data points or patterns that deviate significantly from the expected behavior of the dataset. For example, a scatter plot can identify the relationship between two variables and any outliers.
- Time-Series Analysis: Time-series analysis can detect data anomalies in datasets that change over time. Time-series analysis involves analyzing the data points in sequence to identify any patterns or anomalies. For example, a sudden increase in credit card transactions in a particular time frame may indicate fraudulent activity.
Example with the Old Faithful Geyser.

The dataset contains information (272 observations) on the eruption durations and waiting times between eruptions of the Old Faithful Geyser in Yellowstone National Park.
We will use Python with Pandas and Scikit-learn libraries to analyze it.
First, let’s plot the dataset:
import pandas as pd
import seaborn as sns
import matplotlib.pyplot as plt
from sklearn.cluster import KMeans

# Dataset acquisition
import ssl
ssl._create_default_https_context = ssl._create_unverified_context
url="https://www.stat.cmu.edu/~larry/all-of-statistics/=data/faithful.dat"
column_names = ["eruptions", "waiting"]
data = pd.read_table(url, names=column_names, delimiter='\s+', nrows=272, skiprows=26)

# Plot the data points
sns.scatterplot(x='eruptions', y='waiting', data=data)
plt.title('Old Faithful Geyser Eruptions')
plt.xlabel('Eruption Duration (minutes)')
plt.ylabel('Waiting Time (minutes)')
plt.show()
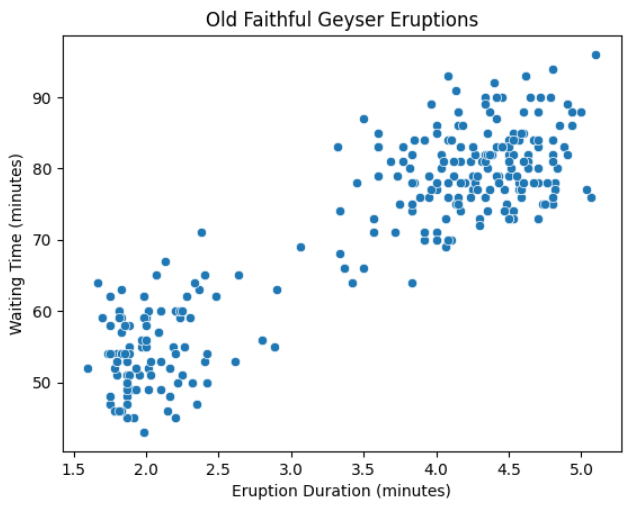
We can notice that the data points tend to form two distinct clusters.
Most of the eruptions have either a short duration with a short waiting time or a long duration with a long waiting time.
However, you might also observe a few data points that don’t fall into either of these two clusters, and these would be considered anomalies in the dataset.
We will use the simple Kmeans method to identify the two clusters.
# Use KMeans clustering to identify two clusters
kmeans = KMeans(n_clusters=2, random_state=452).fit(data[column_names])
data['cluster'] = kmeans.labels_
data['distance']=data.apply(lambda x : kmeans.transform([x[column_names].values])[0][int(x['cluster'])],axis=1)
# Plot the data points
sns.scatterplot(x='eruptions', y='waiting', hue='cluster', data=data)
plt.title('Old Faithful Geyser Eruptions')
plt.xlabel('Eruption Duration (minutes)')
plt.ylabel('Waiting Time (minutes)')
plt.legend(title='Clusters', loc='upper left')
plt.show()
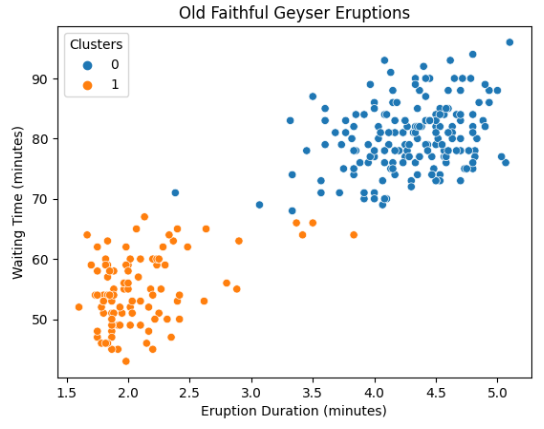
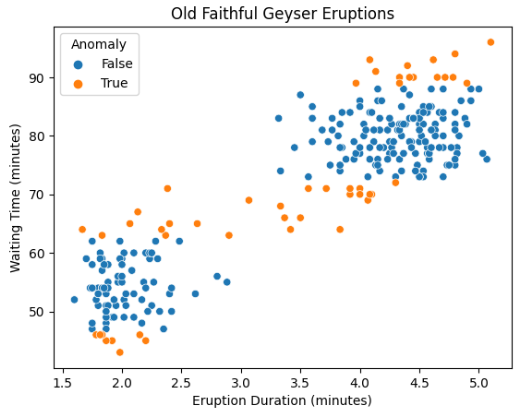
We would identify as anomalies any data points deviating from their cluster center by more than 2.5 times the standard deviation of the distance of all the points within the cluster.
# Define a threshold for anomalous data
threshold = 2.5 * data['distance'].std()

# Identify anomalous data points
data['anomaly'] = data['distance'] > threshold

# Plot the data points
sns.scatterplot(x='eruptions', y='waiting', hue='anomaly', data=data)
plt.title('Old Faithful Geyser Eruptions')
plt.xlabel('Eruption Duration (minutes)')
plt.ylabel('Waiting Time (minutes)')
plt.legend(title='Anomaly', loc='upper left')
plt.show()
Dealing with Data Anomalies
Once data anomalies have been detected, they need to be corrected to ensure accurate data analysis results.
There are several techniques for dealing with data anomalies, including:
- Removing Anomalous Data Points: One technique for dealing with data anomalies is removing anomalous data points from the dataset. However, this technique should be used with caution as it can significantly reduce the dataset’s size and affect the accuracy of data analysis results. Removing too many data points can lead to underfitting, where the model fails to capture the true relationship between the variables.
- Imputation: Imputation involves replacing anomalous data points with estimated values based on the other data points in the dataset. Imputation techniques can be simple, such as replacing the anomalous data point with the mean or median value of the dataset. More advanced imputation techniques, such as regression and K-nearest neighbor imputation, can be used to estimate more accurate values.
- Transformation: Data transformation involves applying a mathematical function to the dataset to change its distribution. Transformation techniques, such as log transformation, can be used to normalize the dataset and reduce the impact of outliers. However, transformation techniques should be used with caution, as they can affect the interpretation of the data.
In addition to these techniques, it is essential to investigate the root cause of data anomalies and take steps to prevent them. This can involve improving data collection and quality control processes, identifying and addressing instrument malfunction or calibration issues, and detecting and preventing fraudulent activity.
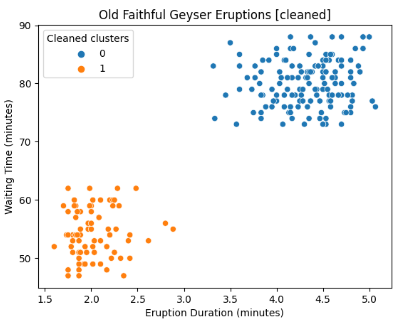
Example with the Old Faithful Geyser.
Concerning Geyser’s observation, we could assume that the anomalies could come from either a wrong observation or simply the non-standard way of nature. In this case, we would prefer to remove them.
# Remove anomalies
data_cleaned=data[data['anomaly'] == False]
# Plot the data points
sns.scatterplot(x='eruptions', y='waiting', hue='cluster', data=data_cleaned)
plt.title('Old Faithful Geyser Eruptions [cleaned]')
plt.xlabel('Eruption Duration (minutes)')
plt.ylabel('Waiting Time (minutes)')
plt.legend(title='Cleaned clusters', loc='upper left')
plt.show()
An Alternative Approach: Leveraging Coresets for Anomaly Detection and Management
A Coreset is a small subset of the dataset which keeps the same statistical properties of the entire dataset and corner cases.
Using the Coreset approach for dealing with machine learning problems (such as anomalous data) offers several benefits:
- Efficiency: Coresets reduce the size of the input dataset, enabling faster processing and analysis without sacrificing the accuracy of the results. This efficiency is especially valuable when dealing with large datasets containing anomalies.
- Provably accurate results: Coresets maintain the integrity of the original dataset, ensuring that solving a problem on the Coreset yields the same result as solving it on the full dataset. This property is essential when working with anomalous data, as it guarantees accurate analysis and preserves the statistical properties of the original dataset.
- Accessibility: Although Coreset’s underlying theory can be technically challenging for beginners to understand, DataHeroes makes it accessible for practitioners by bridging the gap with a set of practical tutorials and a library.
With the Coreset approach, one can efficiently identify and handle anomalous data by leveraging the “importance” value (i.e., the maximum contribution of a point to the loss/cost function compared to other points) assigned to each data point during the Coreset construction.
Compared to other approaches during which the datasets are randomly reviewed, using the importance value associated with each data point can be 5 to 10 times more effective.while maintaining accuracy.
This streamlined approach allows for the targeted investigation of potential anomalies and enables faster and more accurate handling of data-related issues, making the Coresets a valuable tool for addressing anomalous data across diverse domains and data types.
See here for further information about “importance” computation and Coresets building
Conclusion
Anomalous data can significantly impact the accuracy and reliability of data analysis and machine learning results. Detecting and correcting anomalous data is essential. There are several techniques for detecting and correcting anomalous data, including statistical methods, machine learning, visualization techniques, and time-series analysis. Once anomalous data has been detected, it can be dealt with using techniques such as removing anomalous data points, imputation, clustering, and transformation. It is also essential to investigate the root cause of data anomalies and take steps to prevent them from occurring in the future.
It is also important to remember that no single technique or approach is suitable for all types of data anomalies. Different types of anomalies may require different techniques for detection and correction. Moreover, the choice of technique may also depend on the specific characteristics of the dataset, such as its size, complexity, and distribution.
Ultimately, adopting a proactive and systematic approach is the key to dealing with anomalous data. This involves regularly monitoring data quality and analyzing data trends to identify potential anomalies before they can affect the accuracy of data analysis results. It also involves establishing clear protocols and procedures for detecting and dealing with anomalous data, as well as training staff in the appropriate techniques and tools for data analysis.
Finally, it is important to recognize that detecting and correcting anomalous data is an ongoing process that requires continuous monitoring and evaluation, for example, using alerts or dashboards. As new data is collected, applying the appropriate techniques for identifying and dealing with any anomalies that may arise is important. By adopting a proactive and systematic approach to data analysis, organizations can ensure that their data remains accurate and reliable and that they can make informed decisions based on sound data analysis results.
To sum up, anomalous data is a common challenge faced by data analysts and can significantly impact the accuracy and reliability of data analysis results. Detecting and correcting anomalous data requires a combination of technical expertise, critical thinking, and problem-solving skills and involves a range of techniques, including statistical methods, machine learning, visualization techniques, and time-series analysis. By adopting a proactive and systematic approach to data analysis, organizations can ensure the accuracy and reliability of their data, and they can make informed decisions based on sound data analysis results.