Incorrectly Labeled Data in Object Detection Datasets Problem
Following a data-centric approach, the quality of the machine learning model is highly dependent on the quality of the data used to train it. We all know the saying “garbage in, garbage out.” Unfortunately, data is often shipped with various bugs and errors. It is a well-known issue that data scientists spend more than half their time cleaning the data. One of the biggest challenges is that there isn’t a go-to method to find errors in your dataset, such as faulty labels or samples that do not fit your business use case.
The Solution: Coreset
Coreset are a sampling methodology originating in computational geometry used to approximate optimization problems. They are based on selecting a subset of the original dataset that maintains the entire dataset’s statistical properties and corner cases. Training a model on the Coreset will give the same result as training it on the full dataset.
When computing a Coreset, every instance in the data is assigned an importance value, which indicates how important it is to the final ML model. Samples that receive a high importance value in the Coreset computation require the attention of the data scientist as they usually indicate a labeling error or other data-related issues. Therefore, leveraging the Coreset, we can easily assign an importance score to each sample. Instances with high importance scores have a high probability of being mislabeled. Thus, we can sample instances of interest by looking at the top percentile of importance.
By speeding up the cleaning process of the dataset, the data scientists can focus on bringing real value and not on housekeeping tasks.
The Goal of the Article
We will use the DataHeroes Coreset service to clean the class labels from the COCO dataset. Using good practices, we will pick a class of interest with potential dirty labels we plan to clean. Afterward, using the Coreset service, we will present a novel sampling method to select instances with a high probability of being mislabeled. Thus, instead of randomly looking at samples with the hope of finding mislabels, the cleaning process will be guided by a systematic sampling method.
This tutorial aims to show how to adequately use the Coreset service to clean your dataset quickly and effectively. More concretely, our scope is to clean or validate the class of every bounding box from the COCO dataset more effectively than using random sampling.
Overview of the Main Steps Within the Article
1. Load COCO Features
2. Pick a Class to Clean
3. Clean the Labels Using the DataHeroes Coreset Package
4. Visualize the Final Result
Using Python, we can import the DataHeroes logistic regression service as easily as the following:
# Import the logistic regression Coreset service, which we will use to clean the dataset.
from dataheroes import CoresetTreeServiceLG
Note: Be careful to set up the license key before using it. Check their site for more instructions.
Load COCO Features
How We Computed the Features 👇
The features we will load are already precomputed within a different script. These were computed from the COCO dataset with the following steps.
- We initialized a ResNet50 classifier pretrained on COCO. We dropped the last classification layer to output an embedding instead of the class distribution.
- We cropped every bounding box within the COCO dataset and considered it an independent sample (with iscrowd = False). Thus we have only samples that contain one single instance of the object/class.
- We passed all the bounding boxes through the ResNet50 model, which outputs a 2048 embedding. On top of these embeddings, we can train a logistic regression for the final classification, and we can also use the Coreset logistic regression service to compute the importance of each sample (note that there is a different Coreset service for every different model – this specific service is using the logistic regression model under the hood)
- We also passed the embeddings through PCA to reduce the dimensions to 256. We will use the reduced dimensions samples to train an LG model to help us find a class of interest we want to clean.
NOTE: We moved these steps to a different script, which takes a few hours to run. Also, you need a GPU and extra dependencies to run it properly. Thus we wanted to keep this article as light as possible.
Using the load() function, we will load the 2048 and 256 precomputed representations of the COCO bounding boxes:
data = load(dir=FEATURES_DIR)
Loaded X_train - shape = (847970, 2048)
Loaded y_train - shape = (847970,)
reduced_dim_data = load(dir=REDUCED_DIM_FEATURES_DIR)
Loaded X_train - shape = (847970, 256)
Loaded y_train - shape = (847970,)
Loaded X_test - shape = (36229, 256)
Loaded y_test - shape = (36229,)
Load COCO Metadata
We use the pycocotools Python package to load and parse the COCO training annotations file:
coco_train = COCO(DATA_DIR / "annotations" / "instances_train2017.json")
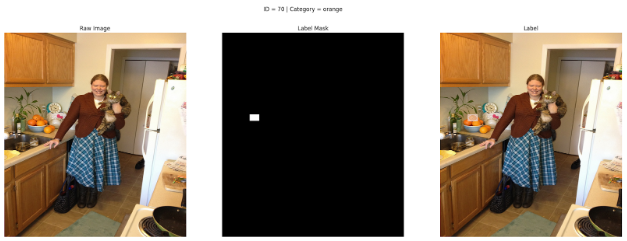
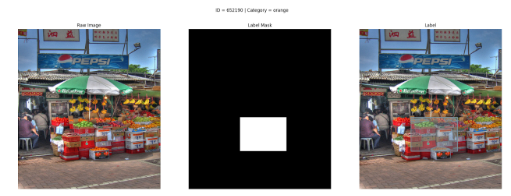
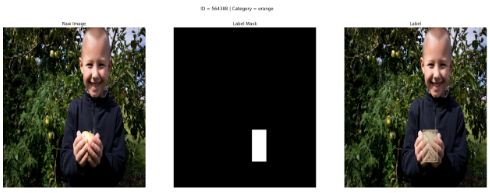
We defined a set of rendering functions with the help of which we can nicely visualize and save every bounding box within the COCO dataset. Out of simplicity, we included this code only in the notebook.
Here is an example of a random bounding box. We exported it into three formats: the raw image, the attention mask of the label (as in many scenarios, it is hard to spot the bounding box), and the bounding box rendered on top of the image.
Pick a Class To Clean
We want to compute the importance only for one class of interest. To do that, we will fit a logistic regression on our training data and calculate the confusion matrix on the testing data. We will take the worst-performing category as our class of interest.
To speed up the computation time, the LG model is trained only on the 256 embeddings, reduced from 2048 using PCA.
clf = LogisticRegression(class_weight="balanced", max_iter=500)
clf = clf.fit(reduced_dim_data["X_train"], reduced_dim_data["y_train"])
Pick the Class Based On the Confusion Matrix
We will use the confusion matrix to find the class that generated the most false positives. Let’s understand this with an example.
We computed the normalized confusion matrix (values between 0 and 1) for five classes: A, B, C, D, and E. The highest value in the confusion matrix was found between the true class A and the predicted class C (ignoring the ones from the main diagonal). This means that class A was confused with class C the most within our testing data (samples of class A were predicted as class C). We will consider class C as our class of interest because there might be issues within the labels due to this high confusion between classes A and C.
y_true = reduced_dim_data["y_test"]
y_pred = clf.predict(reduced_dim_data["X_test"])
cm = confusion_matrix(y_true, y_pred, normalize="true")
# To extract the highest confusion, we need to ignore the diagonal matrix.
np.fill_diagonal(cm, 0)
# Now, we can quickly grab the maximum value out of the matrix.
true_class_id, predicted_class_id = np.where(cm == cm.max())
true_class_id, predicted_class_id = true_class_id[0], predicted_class_id[0]
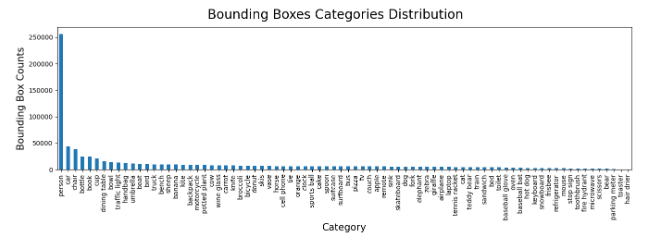
We found out that our class of interest is “orange” with a total of 6300 samples (or bounding boxes). Also, the most confused class is “apple,” with 5773 samples (the classifier predicted orange instead of apple).
NOTE: To speed up the training, we kept only samples from these two classes: “orange” or “apple”. Ultimately, we will use the Coreset service to sample only “orange” instances. Thus, this decision won’t affect the cleaning process but will speed up the experimentation process. After keeping only the essential classes, the training data size was reduced from 847970 to 12073 samples.
Clean the Labels Using the DataHeroes Coreset Package
We will use the Coreset service as a novel sampling method to review samples with potentially incorrect labels. How does this work?
Using CoreseterviceLG, we will compute an importance score for every sample. Samples with high importance have a high potential to be either mislabeled, out of distribution or other anomalies (occluded, blurred, strange shapes, etc.). Thus, we have a significant probability of finding dirty labels by taking the top N samples with the highest importance. Another well-known approach to cleaning data is random sampling. When the data is small, random sampling works well, but as the data gets larger (which is the case for real-world scenarios), randomly looking at samples and hoping to find something isn’t practical anymore. Thus, using the Coreset, you will always look only at samples with a high potential to be mislabeled.
Below is the definition of the function that finds top N samples with the highest importance values using a set of features X and labels y for a given class of interest.
def compute_importance(
    X: np.ndarray,
    y: np.ndarray,
    of_interest_class_id: int,
    export_n: int,
    service: Optional[CoresetTreeServiceLG] = None
    ) -> dict:
    """Function that uses the coreset logistic regression service to find top N important samples from the given data.

    Args:
        X (np.ndarray): input features
        y (np.ndarray): input labels
        of_interest_class_id (int): the class to look at and export from
        iteration (int): current cleaning iteration
        export_n (int): the top number of samples to export
        service (CoresetTreeServiceLG): if the Coreset service is given as a parameter, it will be directly used to compute the importance. Otherwise, it will be built before calculating the importance.
    Returns:
        dict: dictionary containing the results from the coreset computation: top importance values, indices, and an aggregated array of viewed indices
    """

    if service is None:
        start_service_time = time.time()
        service = CoresetTreeServiceLG(optimized_for='cleaning')
        service.build(X, y)
        end_service_time = time.time()

        print(f"Coreset computed in {end_service_time - start_service_time:.2f} seconds.")

    result = service.get_important_samples(
            class_size={of_interest_coco_class_id: export_n}
        )
    important_sample_indices, important_sample_values = result["idx"], result["importance"]

    return {
        "service": service,
        "important_sample_indices": important_sample_indices,
        "important_sample_values": important_sample_indices
    }
Now, we will define one last component that will update the Coreset service with the cleaned data. Using this approach, we build the whole Coreset only once, in the beginning, and after every cleaning iteration, we just update it with the newly cleaned data. This method reflects two possible cleaning actions: change the label or remove the sample.
def update_coreset_service(
    service: CoresetTreeServiceLG,
    X: np.ndarray,
    y: np.ndarray,
    sample_weights: np.ndarray,
    corrections: pd.DataFrame
    ):
    """Function that updates the coreset service with the cleaned data.

    Args:
        service (CoresetTreeServiceLG): Coreset service to be updated
        X (np.ndarray): input features
        y (np.ndarray): fixed labels
        sample_weights (np.ndarray): input features mask (used to mark deleted samples)
        corrections (pd.DataFrame): correction DataFrame that contains the corrected indices from the current iteration
    """

    # Update the Coreset with the corrected labels.
    corrected_indices = vectorized_map_coco_sample_id_to_slim_sample_id(corrections["COCO Sample ID"].to_numpy())
    service.update_targets(
        indices=corrected_indices,
        y=y_train_slim[corrected_indices]
    )

    # Signal invalid samples.
    deleted_indices = np.where(sample_weights == 0)[0]
    current_iteration_deleted_indices = deleted_indices[np.isin(deleted_indices, corrected_indices)]
    service.remove_samples(current_iteration_deleted_indices)
Finally, Let’s Start Cleaning
The cleaning process is split into multiple iterations. For every iteration, we will do the following:
- compute the importance of each sample based on the Coreset
- export top N samples with the highest importance that we haven’t seen so far (in our use case, N = 60)
- manually correct the exported samples
- load the exported samples and correct the current labels
- compute the AUC metric based on the corrected labels using K-fold cross-validation
- Repeat steps 1-5 until the AUC score plateaus. It is essential to highlight that a new Coreset is computed in every iteration based on the corrections done in the previous steps.
NOTE: Using DataHeroes’ package, we can find samples with a high probability of being wrong, but it doesn’t automatically tell us the correct label. Thus, the cleaning step is done manually. We created a simple cleaning interface by saving all the proposed images to disk and a CSV file with their indices and the actions we want to take for every sample. Because the manual cleaning process is custom and tedious, we will highlight only the main components to keep the article concise.
The cleaning process consists of two possible actions:
- Validate that the label is an “orange” or switch it to “apple”. This case is obvious: an apple is labeled as an orange.
- Delete the samples. This case isn’t that obvious. It can consist of the following scenarios: the class is wrong, and it doesn’t exists (remember that we currently test only on apples and oranges), the bounding box contains multiple types of objects (one exception which we accepted is when it includes a single orange that is occluded by other objects), or the bounding box is entirely faulty (the coordinates do not match the object).
Important observation: Before starting the cleaning process, it is essential to examine multiple samples to understand and define clear rules about valid and harmful labels. If that isn’t 100% clear, by cleaning, you might do more wrong than good. In our concrete example, along with regular oranges, the dataset also contains blood oranges. Initially, I started marking them as invalid, as I didn’t know such an orange type existed. Until one colleague said that red oranges exist, which are blood oranges. Imagine how easily such errors can propagate when working with multiple people. The good news is that using Coreset can quickly look at the most important samples that define your dataset’s statistical properties.
We initialized a set of parameters that will keep updating along the cleaning process. “slim” refers to the dataset containing only oranges and apples.
# We will clean the labels in a new copy of the initial labels arrays.
y_train_slim_fixed = np.copy(y_train_slim)
sample_weights_fixed = np.ones(shape=(X_train_slim.shape[0], ), dtype=np.int32)
# In this variable, we will aggregate metrics across iterations.
aggregated_results = initialize_aggregated_results(X=X_train_slim, y=y_train_slim_fixed)
Let’s see an example of an iteration 👇
Steps 1 & 2 of the iteration: Using the export_top_importance() function, we will compute the importance for all the given samples and export 60 samples with the highest importance. We exported the samples in a custom format that will allow us to clean them further down the line. But the interface itself is problem dependent and out of the scope of this article.
exporting_data_iter_0 = export_top_importance(
    X=X_train_slim,
    y=y_train_slim_fixed,
    of_interest_class_id=of_interest_coco_class_id,
    export_n=EXPORT_N,
    iteration=aggregated_results["iteration"]
)
Below we can visualize the histogram of the importance values attached to each sample. We can observe that within the first iteration, we have a high density at the top percentile.
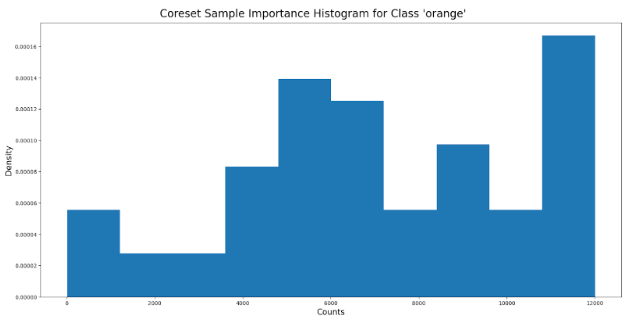
Step 3: We manually reviewed each sample and corrected them based on the following actions: choose the label between “orange” or “apple” or delete the sample if the bounding box is faulty.
Steps 4 & 5: Load the corrections from the disk and merge them into y_train_slim_fixed and sample_weights_fixed. We used y_train_slim_fixed to choose between “orange” and “apple” and sample_weights_fixed to either keep the sample or delete it. We utilized the newly corrected labels to compute the AUC score using K-fold cross-validation.
cleaned_data_results_iter_0 = clean(
    X_train=X_train_slim,
    y_train_slim=y_train_slim_fixed,
    sample_weights=sample_weights_fixed,
    metadata_train=data["metadata_train"],
    iteration=aggregated_results["iteration"],
)
In the end, we aggregated the results to visualize them later on:
aggregated_results = aggregate_iterations(
    iteration_results=cleaned_data_results_iter_0,
    aggregated_results=aggregated_results
    )
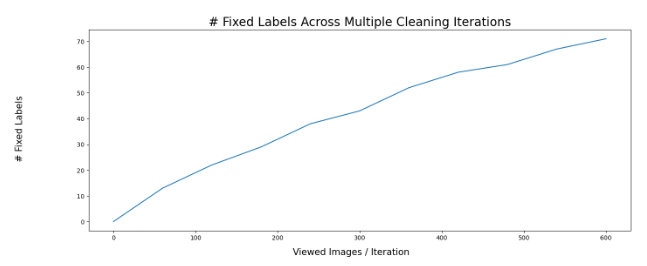
NOTE: We repeated the cleaning process for ten iterations, looking at 600 bounding boxes out of a total of 6300 samples.
Why did we stop after ten iterations?
Because the AUC scores plateaued. Let’s see this ourselves.
Visualize the Final Results
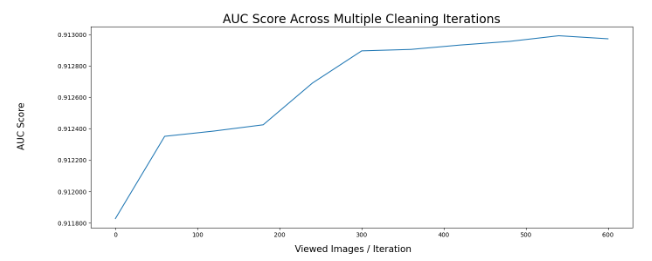
AUC Score Across Iterations
By looking at the graph below, we can see that the AUC score improved solely by cleaning the labels. In this case, by looking only at 600 / 6300 samples, we improved the AUC score by ~0.15% without doing anything else.
Note that COCO is a well-known, clean dataset. Even in such a scenario, we managed to increase the AUC score solely by cleaning the dataset. Thus, this strategy would have a significantly higher effect in a real-world system, where the data is considerably dirtier and harder to debug. We used the newly corrected labels to compute the AUC score using K-fold cross-validation.
Fixed Samples Across Iterations
Using this strategy, we cleaned 11.83% of the total samples we looked at.
Let’s Take a Look at Some Dirty Samples That We Cleaned
Awful. The bounding box spans multiple fruits and boxes.
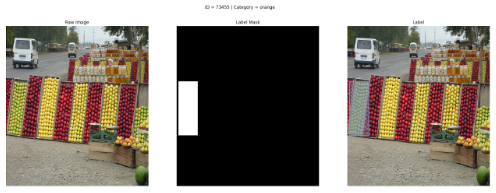
A crowd of apples is labeled as a non-crowd of oranges.

A slice of lime labeled as an orange.
An apple is labeled as an orange.
The bounding box consists of a group of peers.
Here we have a group of tomatoes labeled as oranges.
Again, an apple is annotated as an orange.
You would have thought that a dataset such as COCO would have been cleaner, but sadly it is not. This is why labeling big datasets is challenging, and the ability to clean and debug them is essential for building robust and unbiased models.
Conclusion
In conclusion, using the DataHeroes Coreset library, we cleaned the labels of the “orange” class from the COCO dataset. We have seen the impact of the cleaning process by an increasing trend in the AUC metric from iteration to iteration. We stopped after ten iterations because the AUC metric plateaued.
Using the DataHeroes Coreset library, we managed to speed up the cleaning process by constantly looking at the top 60 samples based on the Coreset importance instead of randomly picking samples with the hope that we would find samples of interest. Thus, using the importance of the Coreset is a more effective way of finding bugs and errors in your dataset.